Dashboards were once the gold standard for business intelligence – every department had one (or dozens). Yet today, many of those carefully crafted charts and graphs sit idle, ignored or out of date. In countless enterprises, “dashboard sprawl” has led to thousands of reports that no one actually checks. As former U.S. Chief Data Scientist DJ Patil noted, companies end up with “too many dashboards that no one looks at,” wasting resources and even slowing down data systems with all the clutter. In fact, only about 20-25% of employees typically use BI tools at all, a rate that has barely budged in years.
Even when dashboards are available, nearly half of business leaders admit they can’t fully utilize them due to complexity or accessibility issues. The result? A proliferation of “orphaned” dashboards and “thrashboards” that drains time and money while offering diminishing returns.
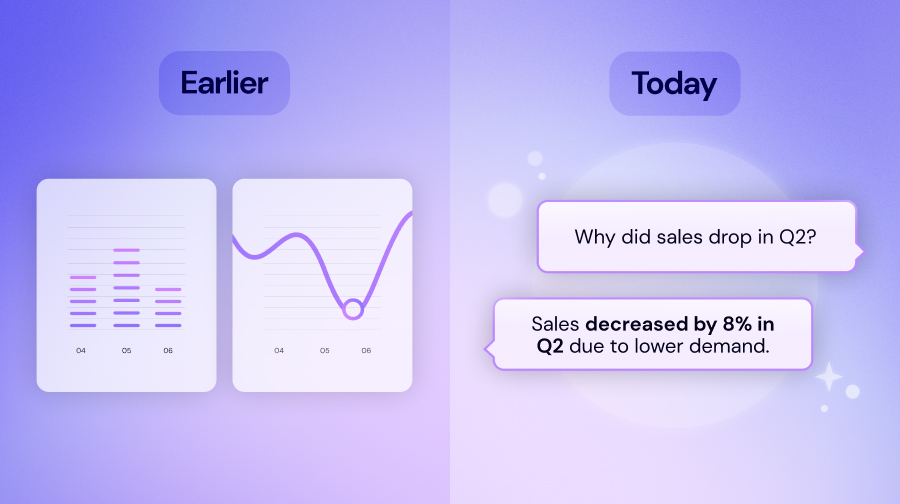
The thesis of this article: Traditional dashboards, long the go-to solution for data insights, have become a bottleneck. Building, maintaining, and interpreting these dashboards requires technical setup, constant upkeep, and forces users to step out of their workflow to hunt for answers. Meanwhile, AI-powered conversational interfaces are emerging as a faster, more intuitive way to get insights – instantly and in natural language. Below, we’ll explore the hidden costs of dashboard-centric BI, how AI agents and conversational BI are changing the game, common concerns (like data quality and “hallucinations”), and why forward-thinking enterprises are embracing this new paradigm. Finally, we’ll conclude with Zive’s perspective on enabling secure, governed AI agents that deliver contextual insights without the need to browse a dashboard.
The Hidden Costs of Dashboard-Centric BI
Time & Maintenance Overhead: Traditional BI dashboards come with significant upkeep. Developing a new dashboard can take weeks of data modeling, design, and iteration – and that’s before the constant maintenance of data refreshes, schema changes, and evolving business needs. Each new question or KPI often spawns yet another dashboard, leading to “dashboard sprawl” and “death by 1,000 filters.” As one expert observed, when dashboards proliferate unchecked, “maintenance gets harder, dashboards get stale [and] turn into trashboards”. Stale or redundant dashboards not only waste analysts’ time but also erode trust (few things undermine confidence like two dashboards showing two different numbers for what should be the same metric). This ongoing overhead is a hidden tax on organizations – time that could be spent on deeper analysis is instead spent babysitting reports.
Low Adoption & Training Needs: Even the most beautifully designed dashboard is useless if people don’t use it. And usage is exactly where traditional BI struggles. Surveys show that on average only ~25% of employees actively use BI tools – a figure “flat for a decade,” according to Gartner. Why so low? Dashboards often require users to understand the tool’s interface, navigate complex filters, and interpret visual data displays – tasks that many busy business folks don’t feel comfortable doing. Cindi Howson, a longtime analytics thought leader, notes that many BI tools are “too difficult for mere mortals to use,” especially when compared to today’s slick consumer apps. The result is heavy reliance on analysts or power users, and costly training programs to improve “data literacy.” Yet despite investments in training, a large portion of decision-makers still find dashboards cumbersome. In one Salesforce study, 41% of business leaders said they couldn’t fully leverage their dashboards due to the complexity of data or the tools. Clearly, expecting every executive or manager to become a part-time data analyst is not a scalable strategy.
Lag Between Question and Answer: Perhaps the most frustrating cost of the dashboard-centric model is the delay it introduces from the moment someone has a question to the moment they get an answer. If the question at hand is “What were our sales numbers for product X last week?” and a dashboard already exists for it, then great – you might get an answer quickly. But what if the question is slightly different or new? Maybe “Why did sales of product X spike in the Northeast last week?” Now you’re at the mercy of an analyst’s availability to dig into the data and either modify an existing dashboard or build a new report. This leads to a backlog of ad-hoc requests. 72% of business leaders say they aren’t satisfied with how long it takes to get answers from their analytics teams. By the time a new dashboard or report is built, the insight may come too late – the market has shifted or the opportunity has passed. This latency is the enemy of agile, data-driven decision-making. Moreover, having to stop one’s workflow to log into a BI tool, find the right dashboard (hoping it even exists), and manually scan for the answer is a context switch that busy leaders often don’t have time for. It’s no surprise, then, that over half of IT professionals report that these data lags have “decreased their company’s performance and reduced their efficiency,” as one study found. In short, traditional dashboards can’t keep up with the pace of modern business questions.
Limited Context – Only the “What,” Not the “Why”: Dashboards are great at showing what is happening – the sales number, the trend line, the open tickets. But they often fall short of explaining why a number is up or down. Finding root causes or deeper insights from a dashboard means the user must do more digging, often by cross-referencing multiple charts or exporting data for further analysis. Pre-built dashboards “are not good for explaining why performance is the way it is”, as they tend to be static snapshots. And if an executive’s follow-up question isn’t answered on the existing dashboard, tough luck – they’ll have to ask an analyst. This lack of interactive exploration is a hidden opportunity cost. As one industry observer put it, a dashboard is like “trying to have a conversation with a wall: the wall looks good, but it won’t really talk back.” It’s no wonder some people end up ignoring dashboards or questioning their outputs – the tool doesn’t easily let them probe or iterate on the data. In the end, valuable insights remain buried because the dashboard only answers the questions we knew to ask when we built it, and no more.
From Static Dashboards to Conversational AI: A New Way to Get Insights
The good news is that we’re no longer stuck with static dashboards as the only way to interact with business data. AI-powered conversational interfaces are turning data analysis into a dynamic, natural dialogue rather than a one-way broadcast. Instead of opening a dashboard and sifting through charts, imagine simply asking a question in plain English (or any language you prefer): “Hey, which products drove our revenue growth last quarter, and why?” In the emerging model of conversational BI, you pose the question, and an AI agent instantly pulls together the relevant data and responds with an answer – often accompanied by a narrative explanation and even follow-up visuals on demand.
This isn’t fantasy; it’s already happening. Recent advances in large language models (LLMs) and natural language processing enable AI systems to understand nuanced questions and translate them into database queries behind the scenes. The result is an experience akin to talking to a smart colleague who has read all your company’s reports. For example, an executive could ask, “What’s driving our customer churn spike this quarter?” and get back not just a number or chart, but a contextual answer like: “Customer churn is up 5% quarter-over-quarter, mainly among our small-business segment. The data suggests a spike in churn in April correlating with a price increase on our Basic plan, and customer feedback cites cost as a top reason for leaving.” In other words, the AI provides a nuanced narrative, not just raw figures. It can even be proactive in explaining causes and recommending next steps, bridging the gap between insight and action.
No more clicking through tabs or wading through filter menus – you just ask, and you get. This immediacy is a game-changer. Studies have found that conversational BI interfaces can cut the time to get insights by up to 60% by eliminating all those intermediate steps. Business users don’t need to have BI training or chase down an analyst; they can get answers in seconds by themselves. As one report noted, “AI agents are already helping teams skip the back-and-forth, ask direct questions, and get clear answers without adding more manual work.”
Equally important, these AI interfaces drastically reduce the friction of context-switching. Instead of leaving your everyday tools to find a dashboard, the AI can live where the user already is – whether that’s in Slack, Microsoft Teams, email, or a voice assistant. Increasingly, employees are asking data questions outside of traditional BI apps – in chat threads, via voice, or through AI “copilots” – and getting answers injected right into their workflow. This means a sales VP in a Zoom meeting can quickly message an AI assistant for the latest pipeline figures and get an immediate answer, or a support manager in Teams can ask for today’s top support ticket drivers and see a summary without ever opening a separate tool. The ability to get real-time insights in context removes the mental barrier that often kept people from using data in daily decisions.
A more intuitive experience is also a more inclusive one. Conversational AI doesn’t just benefit the tech-savvy; it makes data accessible to anyone who can ask a question. This has the potential to finally break the adoption stalemate in BI. When interacting with data becomes as easy as chatting – no coding, no drag-and-drop UIs, no arcane SQL – suddenly every stakeholder can be a data user. As IBM’s AI leaders put it, “with simpler interfaces that include conversational interfaces, interacting with data [becomes] as easy as having a chat,” democratizing data access to non-technical team members. In practice, that might mean a regional manager who previously ignored the BI portal can now just ask, “How are my region’s sales today compared to last week?” on her phone and get a quick answer she trusts. This ease of use helps build a data-driven culture by meeting people where they are and how they naturally communicate.
Crucially, AI-driven analytics can provide not just the “what” but also hints of the “why” – something dashboards struggled with. Because these systems leverage machine learning and can be connected to a variety of data sources, they’re capable of synthesizing information and pointing out correlations or anomalies that a static report might not show. They can follow up your initial question with relevant prompts: “Churn is up 5%. Would you like to see the breakdown by customer segment or product? There’s an interesting pattern in the small-business segment.” This back-and-forth ability – essentially, the AI can handle follow-up questions on the fly – means analysis can keep pace with a decision-maker’s train of thought. It’s a far cry from the days of submitting a question to the BI team and waiting days for an answer. As one commentator observed, “the interface becomes less about clicking and more about conversing — much like talking to a trusted advisor who understands both the language of business and the intricacies of the data.” In effect, AI is turning BI from a static monologue into a fluid dialogue.
Real-Time, Multi-Source Insights – Instantly
Another big advantage of AI-driven interfaces is their ability to draw on multiple data sources in real time. Traditional dashboards are usually limited to the datasets they were built on. If the data you need lives in three different systems – say your CRM, your finance database, and an external market feed – you might have three separate dashboards or a complicated data pipeline feeding a data warehouse. An AI agent, however, can be connected via APIs or connectors to many systems at once and pull relevant information from all of them when you ask a question. It can “integrate disparate data sources, synthesize insights, and present them in a narrative form that’s easily digestible,” effectively doing the heavy lifting of data integration on the fly. For example, a question like “Is our customer acquisition cost trending higher, and how does it compare to industry benchmarks?” could prompt the AI to fetch internal marketing spend and new customer data, while also retrieving a benchmark from an industry report or SaaS metric dataset – giving you a composite answer that a single dashboard alone wouldn’t have contained.
This ability to be data-agnostic and pull from anywhere makes AI assistants extremely powerful. Executives no longer have to flip through different tools and reports to connect the dots. The AI can join the dots for you. Jim Liddle, an innovation officer interviewed in Senior Executive, predicted that “Execs will be able to ask complex business questions and receive synthesized insights combining their internal data with relevant market signals” – exactly the kind of multi-source analysis that previously took analysts days to prepare. In short, conversational AI liberates data from silos.
Real-time data is another game-changer. Dashboards often refresh on a schedule (maybe nightly) and can quickly go stale. But an AI agent hooked directly into live systems can fetch up-to-the-minute information. If inventory levels or web analytics are updating by the minute, an AI query can reflect that immediately. In fast-moving scenarios – like monitoring an online campaign or responding to a sudden supply chain disruption – having live answers is invaluable. The AI essentially acts as a real-time analyst on call 24/7. One outcome is that decision-makers can move from relying on periodic reports to an always-on conversation with their data. The moment a question arises, they can get an answer. This immediacy and flexibility explain why analysts are forecasting a significant shift in how we consume analytics. Gartner, for instance, predicts that by 2028, 60% of existing dashboards will be supplanted by automated, AI-driven narratives and dynamic data stories rather than manual charts. The writing is on the wall: static dashboards are giving way to more responsive and intelligent tools.
It’s worth noting that AI isn’t necessarily “killing” dashboards so much as transforming them. Some visualizations will always be useful – humans are visual creatures, after all. The difference is that instead of humans manually searching for insights in those visuals, AI will increasingly surface the insight first, and then generate or point to a visualization as needed. In the future, you might ask the AI a question and it verbally explains the key insight while also popping up a relevant chart or graph for confirmation. The next-gen “dashboard” may not look like a grid of charts on a web page; it may feel like a conversation with an AI that also shows you visuals as supporting evidence. In that sense, AI-powered analytics could make dashboards feel alive – more like an interactive coach than a static report. As members of an AI think tank recently discussed, the future dashboard will be less a passive tool and more of a “collaborative copilot” for decision-making, with natural language and predictive analytics built in.
Addressing the Objections: Can We Trust AI with Our Data?
Anytime a disruptive technology comes along, especially in an enterprise setting, it’s wise to scrutinize its limitations. AI-powered BI is no exception – executives rightly ask questions like “Can I trust the answers this AI gives me?”, “What about data security and privacy?”, and “How do we prevent mistakes or ‘hallucinations’ in AI responses?” Let’s tackle these concerns one by one.
Data Quality & “Garbage In, Garbage Out”: First, it’s important to note that many so-called AI mistakes actually originate from data issues. One provocative observation in the industry is that LLMs (large language models) aren’t hallucinating – your enterprise data is gaslighting them! In other words, if an AI agent pulls from a database that hasn’t been cleaned or a knowledge base full of outdated information, the answer you get is only as good as that source. This puts a spotlight on the need for robust data quality and governance. The AI revolution is in fact forcing organizations to confront long-standing data hygiene issues. Strong data governance is becoming the top priority to ensure AI delivers accurate and trusted results A recent study found that lack of data governance is the number one challenge companies see in implementing AI, and fortunately we’re seeing a big uptick in enterprises investing in governance programs to address this. The lesson: if you feed the AI consistent, clean, and well-defined data, you dramatically reduce the odds it will produce a nonsensical or inconsistent answer. This is akin to the old IT adage of “garbage in, garbage out,” now applied to AI – and smart companies are taking it seriously by cleaning up their data acts.
Preventing Hallucinations and Ensuring Accuracy: Beyond general data quality, what about the fear that an AI might “hallucinate” – that is, confidently give a response that is just plain wrong or not actually supported by the data? This is a known issue with generative AI models that have been trained on the open internet; they can sometimes fabricate plausible-sounding answers. In an enterprise BI context, however, we have tools to rein that in. One approach is grounding the AI in your proprietary data. Instead of letting it freely generate answers, the AI agent is designed to fetch facts and figures from approved databases, data warehouses, documents, etc., and use those as the basis for its answers. Essentially, the AI becomes an intelligent layer on top of your single source of truth. This greatly minimizes hallucination because the AI isn’t making up a number – it’s retrieving the number from your sales system or ERP. If it cannot find the answer, a well-designed system will either say it doesn’t know or prompt for clarification, rather than inventing something. Furthermore, enterprises are exploring techniques like retrieval-augmented generation (RAG), where the AI pulls in relevant snippets of information (like a specific revenue figure or a policy document excerpt) and cites them as it answers, providing transparency. The key is that with proper guardrails, AI copilots can be built to “stay in their lane,” delivering answers based on authorized data and logic. As one BI expert noted, “whether insight is consumed in Tableau, Power BI, Excel, a Slack bot, or through a GenAI agent, the answers [should] draw from the same semantic foundation”. That means the AI and your dashboards (if you still use them) are singing from the same songbook – no random off-script answers.
It’s also worth noting that the fear of AI being inaccurate, while valid, hasn’t stopped businesses from adopting these tools at record pace. In fact, more than 78% of organizations are now using AI in some form – the highest percentage ever recorded – and ChatGPT-style interfaces have hundreds of millions of weekly users. The reality is that people are finding the benefit of fast, conversational answers outweighs the risk, especially as we put safety nets in place. And those safety nets (data governance, validation rules, user feedback loops to catch errors) are getting stronger. As one recent article pointed out, AI hallucinations haven’t slowed adoption at all; instead, they “highlight why strong data governance is essential to improving accuracy and trust.” In practice, this means companies are doubling down on things like semantic layers, which enforce consistent definitions (so that “customer count” means the same thing everywhere), and on access controls, which ensure an AI agent only shows data to people who have permission to see it. Modern conversational BI tools often come with enterprise-ready features: audit logs (so you can trace what data was shown in response to a question), user authentication, and the ability to mask or omit sensitive information. These features help address the “trust” question head-on – both trust in the accuracy of the content and trust that using the AI won’t inadvertently expose something it shouldn’t.
Security & Governance: Speaking of exposure, data security is paramount in enterprise settings. No CIO wants an AI tool that could become a data leakage risk. That’s why the leading solutions focus on secure, governed implementations. In practice, this means the AI lives within your firewall or virtual private cloud, and it respects all the role-based access controls you’ve set up in your data systems. If a manager is only allowed to see sales figures for their region, the AI will know that context (through integrations with identity management and your existing BI security model) and will not include other regions’ data in its answer. We also see the use of “policy wrappers” around AI – basically, rules that define what the AI can or cannot do. For example, an enterprise might configure the AI to never reveal personally identifiable customer information or to refrain from answering questions on certain sensitive topics. All queries and responses can be logged and monitored. In short, the enterprise AI agent is not a wild, black-box chatbot; it’s an augmented analytics tool embedded in your governed data ecosystem. When implemented correctly, organizations can get the agility of conversational AI without sacrificing the oversight and control that enterprise IT requires.
To illustrate, consider the concept of a semantic layer in BI (championed by companies like AtScale). The semantic layer is essentially a governed data model that sits between your raw data and your tools, enforcing consistent metrics and access rules. In the era of AI, this becomes even more critical. If you have a solid semantic layer, your AI agent can leverage it to answer questions with the same definitions and restrictions as any dashboard would. One executive put it bluntly: “If you don’t have good semantics, it’s not just three dashboards giving different answers, it’s thousands of people getting inconsistent results from LLM (AI) queries.” Governance, in other words, is the antidote to chaos in both traditional BI and AI-driven BI.
Finally, let’s address the cultural objection: are people ready to trust an AI instead of a dashboard? Trust is earned, and users will trust the AI when it proves useful and accurate over time. Early implementations often start with a augmentation approach – for example, the AI might provide an answer and also show which data sources it used or even the SQL query it ran behind the scenes. This transparency helps skeptics validate the answer if they want. Over time, as executives see that asking the AI yields correct answers much faster than their old manual process, confidence builds. It’s much like how, years ago, people were wary of self-driving features in cars – now many trust adaptive cruise control or lane assist because the system has demonstrated reliability in those domains. In analytics, trust will build as the AI assistant consistently provides the right insight and flags uncertainty when it exists. And importantly, if the AI ever doesn’t know or isn’t confident, it should say so (or defer to a human), which paradoxically will increase trust rather than having it bluff. The bottom line: with proper design, oversight, and integration into the company’s data fabric, the objections to AI-powered BI are surmountable. In fact, those efforts to surmount them (better data governance, clearer metrics, stronger security) benefit the whole analytics program – AI or not.
A New Paradigm for Enterprise BI – And Zive’s Perspective
It’s becoming clear that we are at an inflection point in how organizations consume data and insights. The old dashboard-and-report paradigm is evolving into an AI-driven, conversational paradigm. This is not just a flashy trend but a response to real pain points and real technological advancements. Executives are no longer content with static charts that can’t keep up with their questions. And now they don’t have to be. As one tech CEO quipped, dashboards are “brittle, stale, and limited,” and “AI-native analytics experiences…are burying them.”The focus is shifting from passive reporting to active dialogue, from one-size-fits-all dashboards to personalized, context-aware insights delivered on demand.
The market is responding accordingly. Virtually every major BI and software player is injecting AI into their products. Microsoft has introduced Copilot for Power BI, allowing users to simply ask for insights in plain language within Power BI’s interface. Salesforce is rolling out Tableau GPT and Einstein AI features so that users can conversationally query their CRM and analytics data. Startups and innovators in the BI space (ThoughtSpot, Sisense, Qlik, and many others) are adding natural language query capabilities or integrating with large language models. And then there are new platforms built from the ground up around this philosophy – platforms like Zive, which aim to deliver secure, governed, multi-source AI agents for the enterprise.
Zive’s perspective (and approach) is that enterprise AI should eliminate the need for most users to ever trawl through a dashboard. Instead of people adapting to the limitations of BI tools, the tools should adapt to the needs of people. In practice, this means providing AI assistants that are contextually aware of your business data, rules, and lingo. Zive’s platform, for example, allows companies to create AI agents that connect to all their relevant data sources – databases, SaaS applications, knowledge bases, etc. – and wrap them in enterprise-grade security and governance. These agents can “retrieve relevant data” on demand, perform multi-step analysis, and even execute workflows, all through natural language interactions. Crucially, they’re not black-box general AIs; they’re grounded in the company’s own knowledge. Zive emphasizes a “deep understanding of business context” – meaning the AI is tuned to your company’s terminology, your metrics, your goals.
Imagine a secure AI copilot that an executive could ask, “Give me a summary of this quarter’s financials and any notable anomalies,” and it would pull from the finance system, the sales CRM, maybe even market news, to produce a coherent, CFO-ready briefing. This copilot would respect role permissions (so a manager asking the same question might get just their department’s slice of the data). It would cite where the numbers come from (building trust), and because it’s connected to live systems, it’s always up to date. No more Monday morning scramble to see if the weekend data loaded into the dashboard – the AI is always on, always refreshed.
From Zive’s point of view, the end game is not to have zero dashboards, but to stop making users hunt for insights. The insights should come to them, wherever they are, whenever they need them. Dashboards become a behind-the-scenes element – perhaps still there for power users or deep dive analysts – but not the primary interface for most business questions. As one industry exec said, dashboards will “sit beside AI copilots” in the new model, which is exactly right. The AI copilot becomes the first-responder for any info need, and the traditional visuals are just one of the tools it can deploy to give an answer.
The potential benefits of this shift are enormous: faster decisions, more informed strategy, and a truly data-driven culture. When people at all levels can instantly get answers (and not just raw data, but interpreted answers) to their questions, they make better decisions. They don’t rely on gut feel as much, and they can iterate on ideas quicker. It also reduces the workload on data teams – instead of building endless variations of reports, those teams can focus on curating high-quality data sources and defining metrics, while the AI takes over the last-mile delivery of insights. One report found that AI-driven automation can “reduce manual reporting work by 40%” for data teams, freeing them up for more strategic analysis. That’s a huge efficiency gain.
To wrap up, “How AI killed the dashboard” is a provocative way to say that we’re moving beyond the dashboard-centric mindset. AI isn’t so much murdering dashboards in cold blood as it is evolving their role and, in many cases, making them invisible to the end user. The value that dashboards provided – turning raw data into something humans can understand – is not lost. It’s being carried forward and amplified by AI, which can do it faster, in a more user-friendly way, and with greater contextual awareness. We will likely always have a need to visualize data, but we’re learning that the visualization can be generated on-the-fly, tailored to the question at hand, rather than pre-baked and waiting on a static screen.
For enterprises, the message is clear: it’s time to re-think your analytics user experience. If your teams are drowning in dashboards and still not getting the answers they need, AI offers a way out. It offers a future where insights find the user, not the other way around; where asking about your business is as easy as chatting with a colleague; and where AI agents act as diligent, real-time analysts for every employee. In this future, the limiting factor on decision-making isn’t the availability of a report – it’s only the questions we dare to ask. And with the help of conversational AI (on a platform designed for enterprise trust and scale, like Zive), even those questions can flow more freely.
The era of endless, static dashboards is drawing to a close. In its place, we have a chance to build an era of interactive, intelligent, and contextual business intelligence – an era where AI-driven conversations unlock insights instantly, and data truly delivers on its promise to inform every decision. The dashboard served us well, but the conversation is just beginning.
.jpg)


